In-Progress (select):
Creating a DAtabank/ReposiTory for Scholars in Technical and Professional Communication (DART Project) (2022-present): Kristin Bivens, Dan Richards, and I are investigating the empirical research practices of scholars in TPC in order to assess the feasibility of establishing a databank/repository. Please contact me (caw0103 at auburn dot edu) for more information about this project.
Visualizing Drug Epidemics–Crack, Opioids, and Media Narratives (2017-present): My work on the ways that data visualizations published in mainstream media outlets frame crack and opioid addiction in particular ways has resulted in two publications: “Precarious Data: Crack, Opioids, and Enacting a Social Justice Ethic in Data Visualization Practice” (DOI: 10.1109/TPC.2022.3144826) and “Visualizing a Drug Abuse Epidemic: Media Coverage, Opioids, and the Racialized Construction of Public Health Frameworks” (DOI: 10.1177/00472816221125186).
In the former article, I analyze the scripto-visual rhetoric of select data visualizations published during both drug epidemics, arguing that different visual rhetoric strategies were used to escalate the perceived threat and also reinforce dominant media narratives that crack addiction was a criminal justice problem but opioid addiction is public health issue. In the latter article, I describe how data visualizations were used in mainstream media coverage during the opioid epidemic to frame addiction to these drugs as a public health issue.
Completed Projects (select):
Interdisciplinarity and Public Health: My article in the Rhetoric of Health and Medicine entitled “RHM, Interdisciplinarity, and an International Public Health Conference: A Dialogue among Stakeholders” uses the journal’s Dialogues format to describe my experience co-chairing the communications and data visualization track for an international public health conference, the International Society for Disease Surveillance. In this entry, I weave in commentary from the conference chair and several contributors who participated in the conference to discuss and reflect on challenges that emerged. Based on this discussion, I then propose several strategies that RHM scholars might draw from in building their own interdisciplinary relationships moving forward.
Critical Digital Health: In 2020 I finished several projects on mHealth apps with Dr. Kristin Marie Bivens that grew out of our 2018 SIGDOC Career Advancement Award. More specifically, in one study we analyzed user-generated review comments posted on the iOS platform for PulsePoint—a novel civilian emergency response app that alerts users when someone nearby is experiencing sudden cardiac arrest. Preliminary results can be found in our Experience Report, which was published in the 2019 SIGDOC Conference Proceedings, and a manuscript outlining our final results has been published in Technical Communication. We also presented these findings at STC’s 2021 Summit Conference and Expo.
In another article published in the Rhetoric of Health and Medicine and entitled “Civilian First Responder mHealth Apps, Interface Rhetoric, and Amplified Precarity,” we use PulsePoint and OD Help–a first responder app used for opioid overdose–as case studies to theorize the ways that the mobile mapping functionality (e.g., Google Maps) embedded in these tools enables but also constrains users’ agential practices.
We also used our usability study on PulsePoint as an example in our Ethical Exposures entry in a special issue of the Rhetoric of Health and Medicine to explore the ethical, logistical, and rhetorical difficulties of creating an RHM databank entitled “Pivoting Toward Rhetorical Ethics by Sharing and Using Existing Data and Creating an RHM Databank: An Ethical Research Practice for the Rhetoric of Health and Medicine.”
And finally, our pedagogically-oriented manuscript, which gives an account of the process we used to cognitively prepare student research assistants to analyze the user-generated content we collected as described above, has been published in Communication Design Quarterly. In this teaching experience report, we pair the hybrid open card sorting-affinity diagramming method that we used in our final analysis of the data (reported in our Technical Communication article) with the revised Bloom’s Taxonomy of learning to show the cognitive scaffolding we designed.
Visualizing Epidemics
My article entitled “Power and Authority in Disease Maps” (JBTC, July, 2015) theorizes early medical cartography through yellow fever maps created to document outbreaks of this disease in the United States.
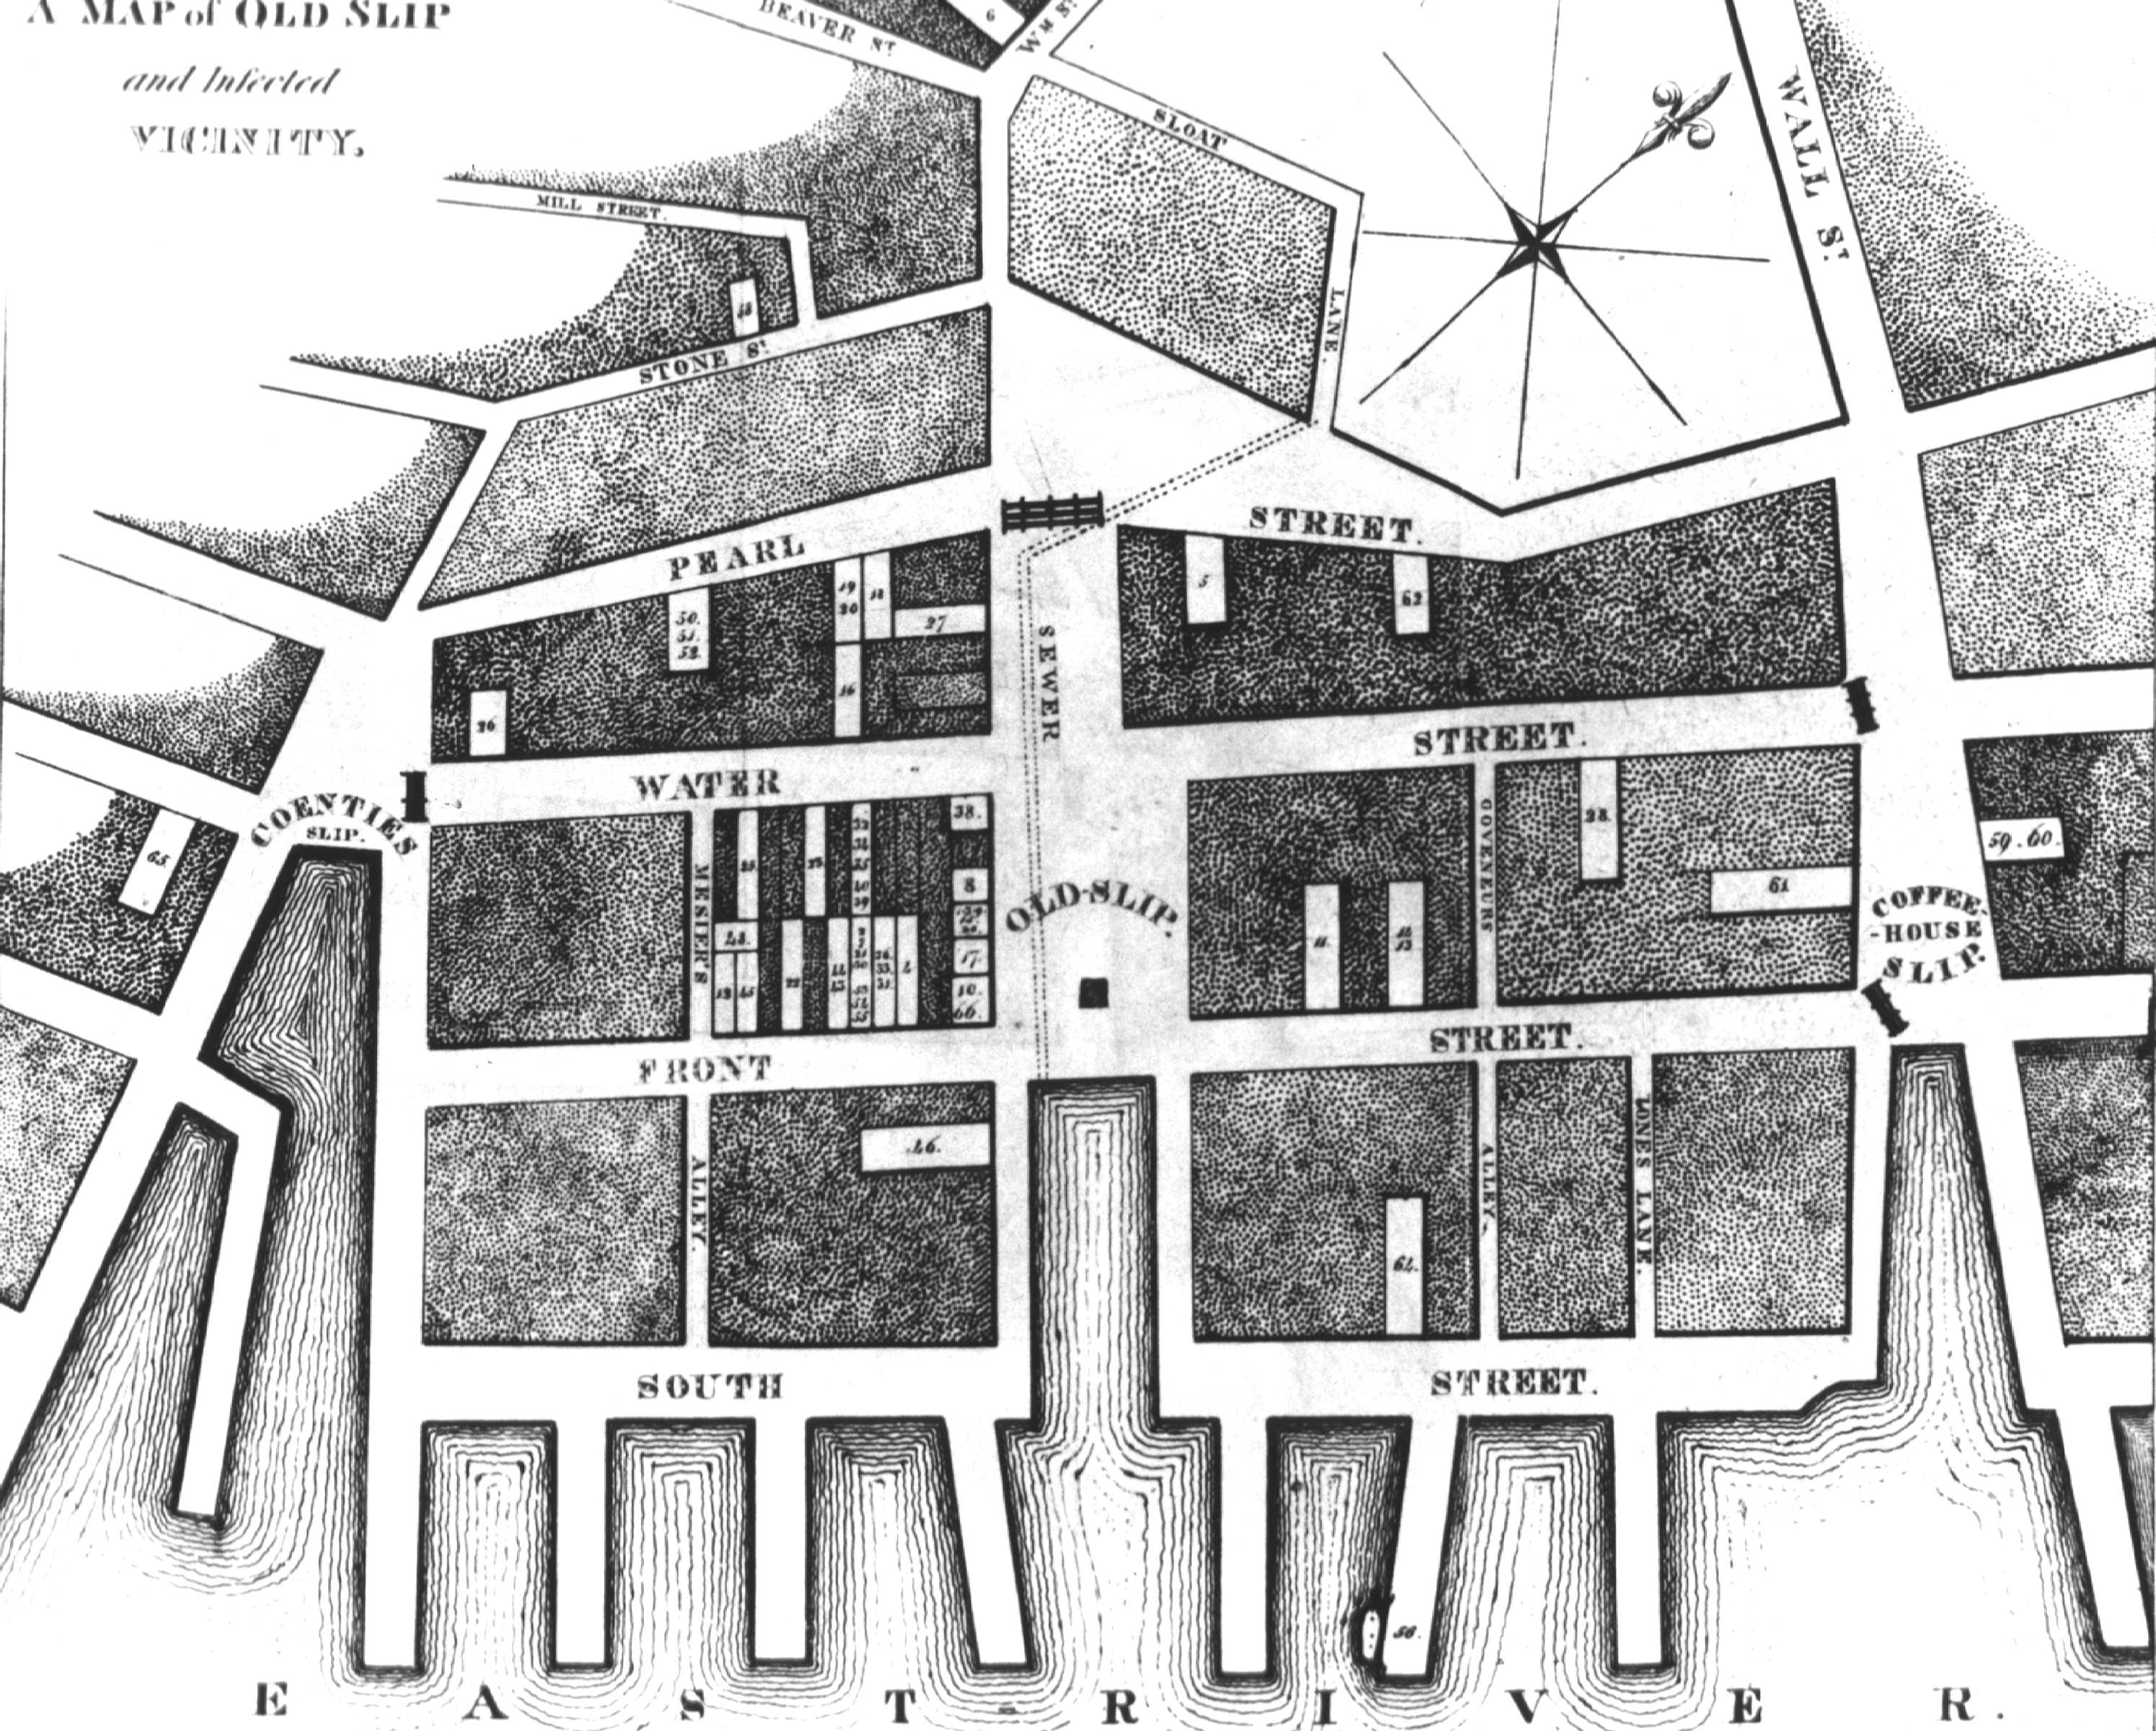
Felix Pascalis’ 1819 map of a yellow fever outbreak in the Old Slip area of New York. Source: National Library of Medicine, History of Medicine Division.
I argue that these early maps invoke power and authority through their visual conventions and scientific authority as statistical graphics as well as by visually reinforcing underlying Western values about disease, illness, and health.
This article serves as the concept piece for my book project, which is currently in-progress (working title: The Picture of (Public) Health: The Past, Present, and Future of Data Visualizations of Epidemic Disease) and investigates how data visualizations have influenced viewers’ understanding of risk of communicable and infectious disease both historically and in the present.
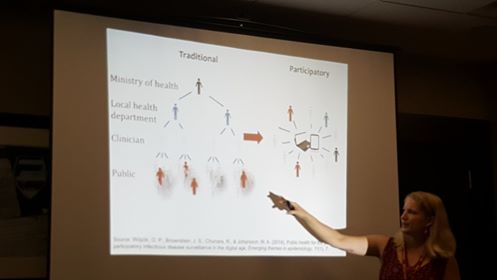
Discussing how participatory surveillance (disease tracking) works in public health at SIG DOC, 2016.
In 2016, Dr. Rebecca E. Burnett and I published a chapter entitled “Visualizing Public Health Risks: Graphical Representations of Smallpox in the Seventeenth, Eighteenth, and Nineteenth Centuries” in Visible Numbers: The History of Statistical Graphics (Eds. Charles Kostelnick and Miles Kimball; 2016).
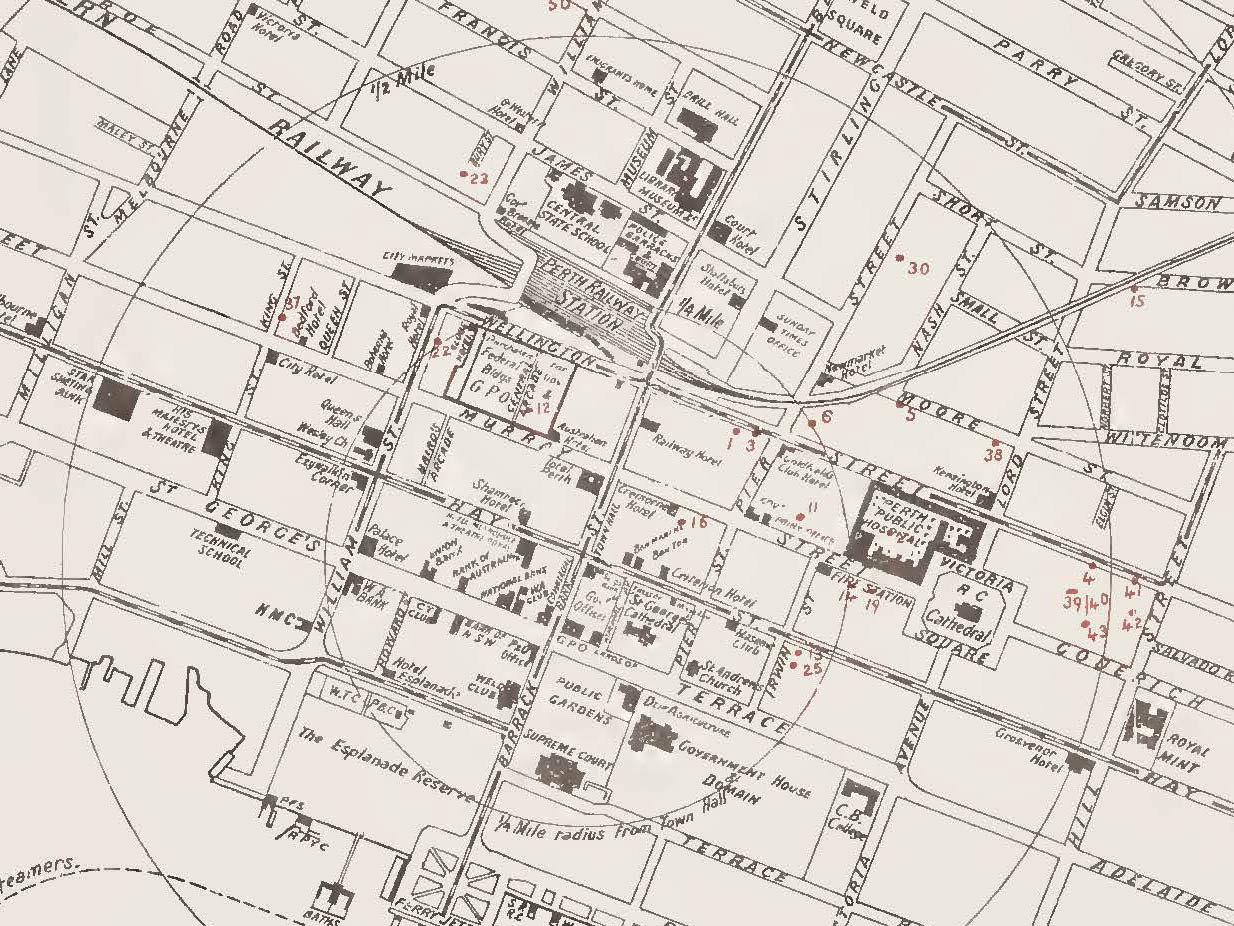
An 1893 smallpox outbreak in North Perth, Australia. Source: Yale University, Harvey Cushing/John Hay Whitney Medical Library
This chapter analyzes selected graphics depicting smallpox epidemics created in the seventeenth, eighteenth, and nineteenth centuries, examining some of the historical and cultural factors that influenced their creation. Rather than adhering to established visual genres for representing quantitative information, which only began to emerge in the early nineteenth century, the creators of these early depictions engaged in three rhetorically driven tasks—correlation, location, and value—that facilitated and shaped risk perception in the field of public health and epidemiology.
